Fractal Sprint | Webinar: How to Build a Governed Developer Platform | Watch Now →

The metric CTOs never look at: the average age of infrastructure debt

The metric CTOs never look at: the average age of infrastructure debt

Introduction

A CTO watches uptime, team velocity, and the monthly cloud bill. Those three are easy to watch: they update themselves, they have dashboards, and they compare month over month without anyone building anything.Now try to answer a different question from those same three dashboards. For each production environment, how long has it been since it last matched the definition it was built from? Uptime cannot tell you. Velocity measures the code your teams ship, not the infrastructure they stopped touching. The bill goes up when things are neglected, not down, so it does not even point in the right direction.That question has a measurable answer, and almost nobody measures it.

The blind spot in standard metrics

Uptime, velocity, and cost describe how a system behaves right now. None of them describes how far a system has drifted from the state it is supposed to be in.An environment can hold perfect uptime for a year while carrying six months of unapplied security patches, because unpatched software runs exactly as well as patched software until the day it does not. It can cost precisely what the forecast said while running a blueprint version nobody has touched since the last reorganization, three revisions behind a definition that has since fixed a permissive network rule and a missing backup policy.Debt of this kind produces no signal on the day it starts accumulating. It produces a signal months later, when a missing patch becomes an entry point, or when an audit discovers that half the estate is running a configuration everyone had assumed was retired. The gap between the day the risk appears and the day anyone notices it is the whole problem, and its length is the thing worth measuring.

Defining the metric

State it plainly: for each running environment, the time elapsed since it was last aligned with the current version of its reference definition. Average across the estate and you have the average age of your infrastructure debt.Three things push the number up:🔷 Definition updates that are never propagated to environments already running. The blueprint improves, the estate does not.🔷 Available security patches that nobody applies, usually because applying them means touching several environments individually and nobody has that week free.🔷 Manual configuration changes made during an incident that never return to the versioned definition. These are the worst of the three, because they move reality away from the definition rather than leaving it behind, which means the definition is now wrong as well as stale.A low age means an environment gets updated on a rhythm. A high age means an environment nobody has touched in months, which will keep looking healthy on every dashboard you own until the moment it stops.

Why it stays invisible

No standard tool reports this as a single number, and the reason is structural rather than an oversight.Monitoring measures availability, so it answers "is it up," not "is it current." Cost tools measure spend, so they answer "what does it consume," not "what does it consume that it should not." Even a Terraform plan run against a workspace gives you today's difference against today's code, which is useful and still not the metric: it tells you nothing about how long the gap has existed, and nothing at all in the common case where each team forked the module, so there is no single current definition to compare against in the first place.To compute the age you need two things most toolchains do not keep: a single authoritative version of the definition an environment descends from, and a record of the last time reality and that version agreed. Without both, the number is not hard to calculate. It is impossible to calculate, and its absence gets read as good news.

A worked example

To see the shape of it, take a hypothetical estate. A team runs twelve production environments, all created eighteen months ago from the same reference definition.Seven have received every update to that definition over the last six months. Their debt age is measured in days. Three were last updated four months ago, when a release froze and nobody came back to it: debt age in months, and the delta includes a change to the default network policy. Two have not been touched in thirteen months, since the team that owned them was reorganized into two other teams, neither of which considered them theirs. Debt age over a year, and nobody currently knows what those two environments are running.On an uptime dashboard, all twelve environments look identical. All twelve are up. With the age metric, the two thirteen-month environments become the top of a queue, discovered by a measurement rather than by an incident or an auditor.To be clear about what that was: an illustrative example built to show the mechanism, not a measured customer case. Before adopting the metric as a standard, check it against your own estate rather than trusting the shape of the story.

Using it to prioritize, not just to worry

The value of this metric is not the generic alarm. Every CTO already suspects there is infrastructure debt somewhere. The value is that it gives an order of work when the team has two weeks and forty environments.Age on its own is not a priority. Age crossed with exposure is. An environment with a thirteen-month debt age, live customer traffic, and regulated data in it is a different object from an environment with the same age used by four people for internal reporting. The first is the next thing you fix. The second is something you decide to decommission, which incidentally is the cheapest way to reduce debt anyone has ever found.

What makes the number available at all

This metric is only computable if two facts are still true after provisioning: an environment knows which versioned definition it descends from, and someone is continuously checking one against the other.That is precisely what a Live System is in Fractal Cloud. An environment created from a Fractal Blueprint stays associated with the versioned definition it came from and is validated against it for as long as it runs, rather than being handed over at the end of provisioning and left alone. Because a blueprint is versioned code written with the Fractal SDK, and because the same definition instantiates across providers without forking, the estate has one current version to compare against instead of one per team. The Fractal Automation Engine owns the operations that close the gap, so realignment is an update to a Live System rather than a manual campaign across environments.That is the mechanism. What it gives you and what it leaves to you are different things. It makes the age of infrastructure debt a fact the platform can know. Turning it into a number on a screen, with a threshold and an owner, is still work a platform team has to want to do, and no vendor dashboard currently hands it over.

Where to start this week

Before formalizing anything, ask the raw version of the question about your five most important production environments: when was the last time each one was aligned with the current version of its definition, and who can answer without going to check by hand?If nobody can answer within a few minutes, the age of your infrastructure debt is already a problem. You just do not have a number for it yet, which is a different situation from not having the problem.

More articles

The metric CTOs never look at: the average age of infrastructure debt

The metric CTOs never look at: the average age of infrastructure debt

A CTO watches uptime, team velocity, and the monthly cloud bill. Those three are easy to watch: they update themselves, they have dashboards, and they compare month over month without anyone building anything.Now try to answer a different question from those same three dashboards. For each production environment, how long has it been since it last matched the definition it was built from? Uptime cannot tell you. Velocity measures the code your teams ship, not the infrastructure they stopped touching. The bill goes up when things are neglected, not down, so it does not even point in the right direction.That question has a measurable answer, and almost nobody measures it.

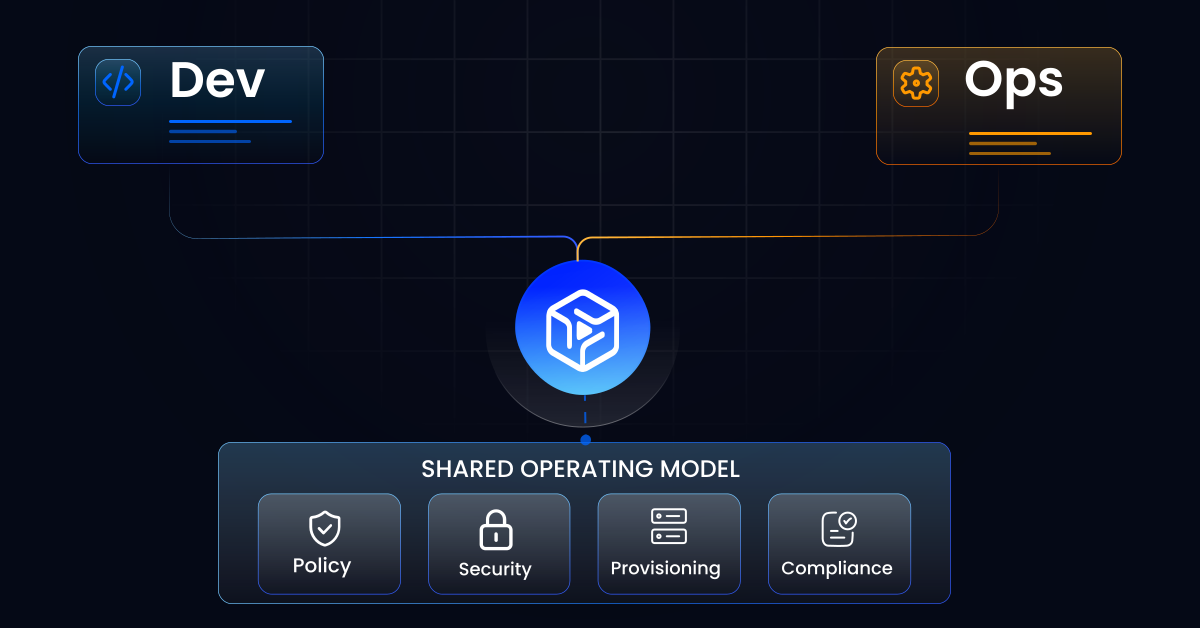
Diagram showing how a shared operating model aligns development and operations teams through Platform Engineering.

How to Align Dev and Ops Without Adding More Tools

Aligning infrastructure teams and development teams comes down, first of all, to the operating model. Tools matter, but on their own they explain little of what slows delivery down.Over the past few years almost every organization has tried to speed up delivery by adopting cloud, containers, and CI/CD pipelines. The outcome tends to repeat itself: developers want to move fast, while whoever runs the infrastructure has to guarantee security, compliance, and cost control. A structural conflict follows, where developers experience controls as a brake and Ops read team autonomy as a risk.There is a fairly precise way to measure that conflict: the cognitive load on developers, meaning how much they have to hold in their head before they can ship. When every team needs Kubernetes, Terraform, IAM policies, and the quirks of each provider, the time spent wiring infrastructure together is time taken from the product. Gartner estimates that by 2026, 80% of large software organizations will have a dedicated platform engineering team, up from 45% in 2022.The useful question, then, is how to design a system where speed and governance stop competing. It is the question Fractal Cloud was built around, and it deserves a general answer before a product one.

Why Great Observability Still Wakes You Up at 3 AM

Why Great Observability Still Wakes You Up at 3 AM

Closing the Loop Between Observability and InfrastructureMost organizations have good observability. They know within seconds when something breaks. And then someone gets paged.Alerts fire into runbooks, runbooks require humans, and humans are a bottleneck. The industry spent a decade solving the seeing problem. The acting problem is still largely manual.According to ITIC 2024 analysis, every minute of downtime costs a data center an average of $9,000. Speed and precision of response are not an operational detail: they are the factor that determines the final cost.There are two reasons this persists: operational data is fragmented across tool silos, so no single system has the full picture; and organizations don't trust automation they can't explain. Both problems need the same fix: a layer that contextualizes events across the full system, reasons deterministically about what to do, and executes infrastructure changes with full traceability.